
Does Higher Model Lift Improve Your Lending P&L?
Back in the day, I recall building a scorecard with two options for a variable measuring 90-day delinquency, one of which resulted in a higher model lift. Normally we recommend the model with the higher lift.
However, in this case, we recommended to the client the model with lower lift. Implementing the higher lift would have cost them $30,000 to re-code and test the new variable in their system.
Yes, but…if preventing the approval of accounts which would incur losses, isn’t that worth the investment in time and money? Not in this case. Why?
The stronger model provided better rank ordering within a segment of accounts which would never be considered for approval. This lender’s P&L (Profit & Loss) would never benefit from the lift.
Evaluating New Models
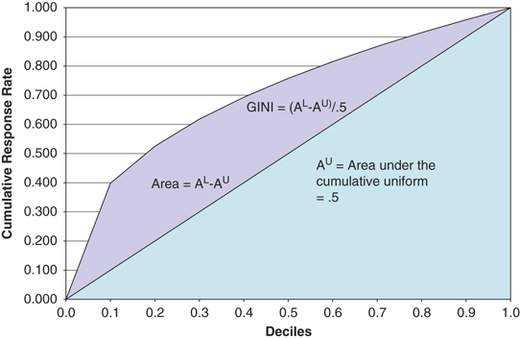
When we are evaluating new models, K-S, Gini, ROC and Divergence run the danger of being vanity metrics if they are not strongly linked to the profit and loss outcomes of the portfolio.
Alongside model lift statistics, typically we have forecasted model outcomes such as:
Measuring Business Impact
These measures are crude tools for the job at hand. What we really want to know is business value. This might include the impact of our new model on customer retention, customer experience and customer lifetime value. These questions are a lot to ask of a historical, static score distribution.
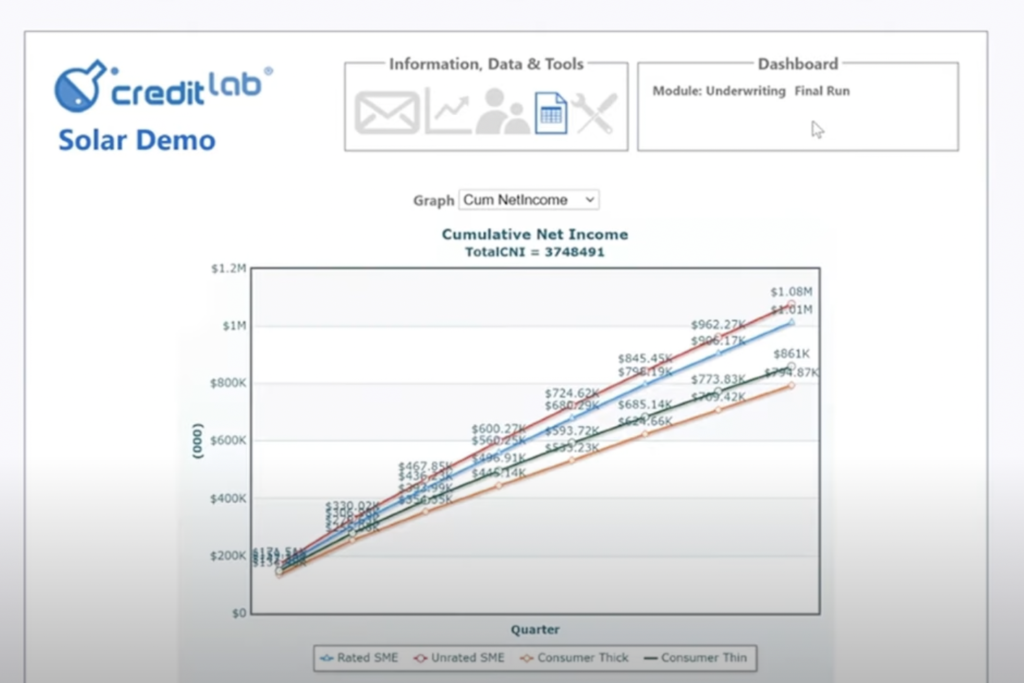
There is good news and a way forward. Using portfolio simulation, we can generate ‘what-if’ scenarios which enable us to analyze the resulting portfolio shape and P&L over time. We have the ability to forecast the business value of new data and models.
This is especially important if the new model incorporates new data sources, such as open banking data, transaction-level data, or real-time data. The new model ‘sees’ the world in a different way. If you continue to ‘see’ the world in the same way, you’ve missed an opportunity to test new strategies and explore new customer segments.
If you’re only working from a historical, static score distribution to inform your new strategy, who could blame you for not exploring new strategies?
The Solution
Portfolio simulation allows you to explore – in a risk-free environment – the most pressing business value questions, such as:
- What is my cumulative net income after two years of using the new score?
- Implications for capital requirements. For example, higher scoring customers tend to have lower credit utilization rates which will impact our capital requirements.
- Customer retention. If I can lower my cutoff and attract customers with lower price sensitivity, what is the impact on customer retention over time?
- Operations for the new credit population. For example, with a new credit population or product features we may need to adjust our operations and customer service.
- Are there new customer segments I can target with the new score? If so, how do they compare to my existing portfolio? Will I need different account management or collection strategies for these new segments?
- Can I increase my loan sizes in some scorebands using the new score? Does the increased revenue balance out the larger losses in case of a default?
- Can I test out new pricing strategies based on the increased power of the new score? If so, in which customer segments?
- If my per-unit cost for the new score is higher, can I be sure I’m getting a strong ROI?
- If the new score reduces delinquency and default, during what timeline can I expect to see those improvements? How long will it take for the newly booked accounts to change the shape of my portfolio?
Remember that your portfolio size and shape, along with the profile and distribution of the customers you are able to attract will drive the results. That is, various lenders won’t see the same results in their P&L from the same score lift.
References: